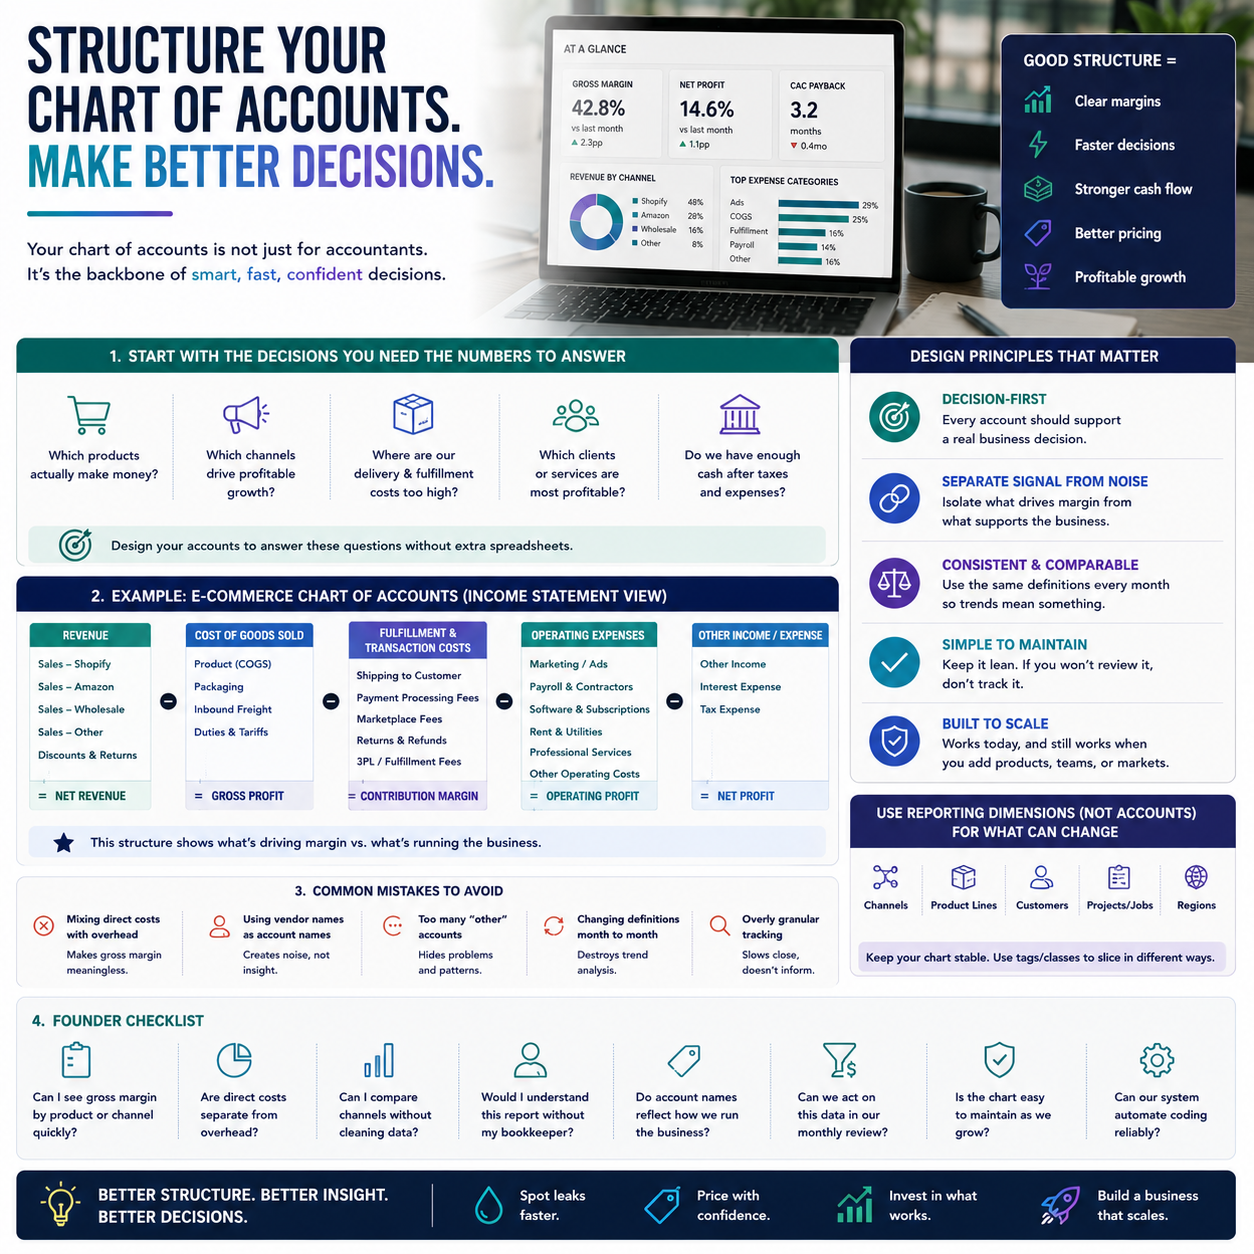
A chart of accounts is often treated like bookkeeping housekeeping, but for founders it is really a decision system. If the structure is messy, your reports become harder to trust, your margins get blurrier, and every monthly review turns into a cleanup exercise instead of a business conversation.
The goal is not to create the most detailed chart possible. The goal is to organize accounts so you can see where money is actually coming from, where it is leaking, and which parts of the business deserve attention.
Start with the decisions you need the numbers to answer
Before adding account codes or renaming expense lines, define the questions you want your accounting system to answer. A founder running an e-commerce business usually needs to know whether product lines are profitable after ad spend, shipping, refunds, payment fees, and packaging. A service business may care more about labor utilization, subcontractor costs, and client-level margins.
That means the chart of accounts should reflect operational decisions, not just tax categories. If your income statement only shows broad buckets like “sales,” “expenses,” and “miscellaneous,” you will struggle to compare channels, products, or service lines.
Use the chart to support a simple reporting rhythm: revenue by channel, direct costs by revenue stream, and operating expenses grouped by function. That structure gives you enough detail to identify problems without making every transaction a bookkeeping project.
Use account structure to separate gross margin from overhead
One of the biggest mistakes small businesses make is mixing direct costs with overhead. When that happens, gross margin becomes meaningless. You cannot tell whether a product is profitable if freight, packaging, merchant fees, ad spend, and fulfillment are buried inside general expenses.
A stronger structure keeps direct costs close to revenue. For example, you might track sales revenue by channel, then separate cost of goods sold, shipping tied to orders, payment processing, marketplace fees, and returns. Once those are isolated, the gross margin number becomes useful for pricing, channel decisions, and promotional planning.
Overhead should sit elsewhere. Rent, software subscriptions, admin payroll, accounting fees, and general office expenses belong in operating expenses unless they are directly tied to delivery. That separation makes it easier to see whether you have a product problem or a cost-control problem.
What most people miss
The chart of accounts is not only for the accountant. It also shapes how your management reports are built. If you want to track channel performance, product family profitability, or client-type economics, the account structure has to support that reporting from the start.
Many businesses try to fix reporting later with spreadsheets, but that usually creates inconsistent definitions. One month shipping is in operations, the next month it is in cost of sales. One team tags ad spend by platform, another groups it all together. The result is reporting that looks detailed but cannot be compared over time.
The better approach is to decide which dimensions belong in the chart of accounts and which should be tracked with classes, locations, projects, or tags in your accounting or ERP system. Use the chart for the permanent structure of the business. Use tracking fields for dimensions that may change as the company grows.
Keep it lean enough to maintain, but specific enough to read
A chart of accounts that is too broad hides business signals. A chart that is too granular creates clutter and slows close time. The right balance depends on how often you review the numbers and who is using them.
For most small businesses, accounts should be specific at the level that affects decisions. If you need to manage shipping cost, separate it. If office supplies are immaterial, do not create ten subaccounts for them. If you sell through multiple channels, split revenue enough to compare them, but not so much that every small marketplace needs its own account unless volume justifies it.
Good structure also helps when you automate bookkeeping. Rules-based coding works much better when account names are consistent and account types are clean. That reduces misclassification, speeds up bank reconciliation, and makes monthly reporting more reliable.
Build the chart around reporting categories, not around vendor names
Another common error is organizing accounts around the names of vendors or tools. That might feel convenient at first, but it usually produces a chart that is hard to interpret. A software subscription should not become its own strategic category unless it represents a material cost center you actively manage.
Instead, group expenses by what they do for the business: sales and marketing, fulfillment, product costs, payroll, admin, professional services, and software. That way you can review spending by business function rather than by a random list of vendors.
This matters when costs start rising. If ad spend increases, you want to see it in marketing expenses. If merchant fees change, you want to see it in payment costs. If returns are eating into margin, you want a separate line for them. The chart should make those patterns visible without extra analysis.
Use the close process to keep the chart useful
A chart of accounts only stays useful if it is reviewed regularly. During the month-end close, check whether new accounts were created for one-off items that should be merged later. Look for accounts with tiny balances that do not help interpretation. Review whether expenses are landing in the right buckets or getting dumped into “other.”
If you add a new revenue stream, product line, or business unit, update the chart before the numbers start accumulating. Retroactive cleanup is possible, but it is slower and less reliable than designing for the new structure early.
As the business grows, you may need to introduce separate reporting layers, but that should be a deliberate change. The chart of accounts should evolve with the business model, not expand by accident.
Use this checklist before you redesign the chart
- Can the income statement show gross margin clearly by revenue stream?
- Are direct costs separated from overhead?
- Can you compare revenue channels without spreadsheet cleanup?
- Are recurring expenses grouped by function instead of vendor name?
- Would a founder understand the report without asking the bookkeeper to translate it?
- Are there any “miscellaneous” accounts that hide real spending patterns?
- Can your accounting system automate coding without constant exceptions?
- Do the account names support pricing, hiring, and spending decisions?
If the answer to most of those questions is no, the issue is probably not the bookkeeping software. It is the structure of the chart itself. For a small business, that structure should make the numbers easier to act on, not just easier to file away.