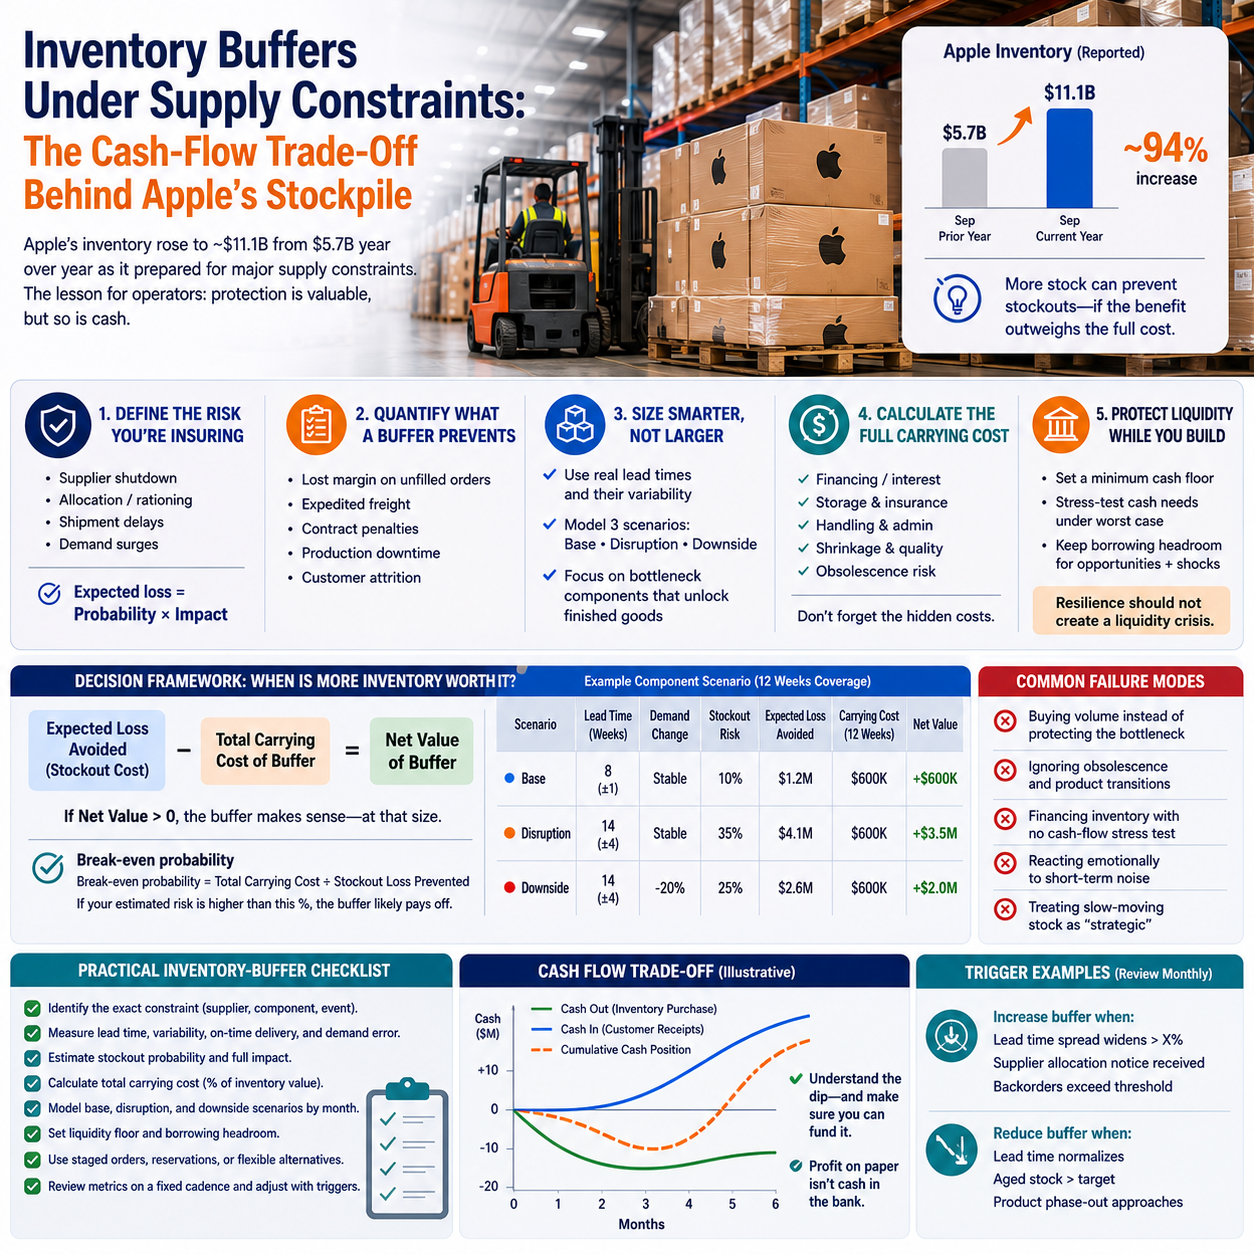
Apple’s reported inventory rose to roughly $11.1 billion, compared with $5.7 billion the previous September, as the company prepared for significant supply constraints. The near-doubling offers a useful case study for operators, but not a universal prescription. A large company with deep liquidity, high product demand and leverage over suppliers can absorb an inventory build differently from a smaller business financing stock through a credit line.
The practical question is not whether more inventory is good or bad. It is whether the expected protection from disruption exceeds the full cost of holding the buffer—and whether the company can survive if its assumptions are wrong.
Start with the loss a buffer is meant to prevent
Safety stock is insurance against uncertainty, not ordinary inventory purchased because sales are expected. Define the event being insured: a supplier shutdown, delayed shipment, allocation of a scarce component or sudden demand increase. Then estimate the financial effect if stock becomes unavailable.
Begin with expected stockout loss: the probability of a shortage multiplied by its likely impact. Include contribution margin lost on unfilled orders, expedited freight, contractual penalties, production downtime and customer churn. Avoid treating every delayed sale as permanently lost; some customers will wait, while others will switch suppliers.
Gross margin changes the calculation. A high-margin product can justify a larger buffer because each prevented stockout protects more contribution. Yet margin alone is insufficient. If demand is unpredictable or the product becomes obsolete quickly, the buffer can destroy value even when unit economics look attractive.
Segment inventory accordingly. Protect components that constrain an entire finished product, have long replenishment times and serve stable demand. Be more cautious with cosmetic variants, seasonal items and products exposed to rapid technical change.
Translate supply uncertainty into stock
A blanket instruction to “add two months” ignores how risk differs among suppliers. Operators should measure average lead time, lead-time variability, supplier on-time delivery and demand volatility. A component arriving consistently in eight weeks may require less safety stock than one averaging six weeks but ranging from three to fourteen.
Run three scenarios. In the base case, use normal demand and current lead times. In the disruption case, extend lead times and apply realistic supplier allocations. In the downside case, combine slower sales with delayed deliveries—the painful outcome in which stock arrives after demand weakens.
For each scenario, model weeks of cover, expected stockouts and the cash conversion cycle. Where possible, test the buffer at the bottleneck-component level. Buying abundant parts does not create resilience if one scarce chip, material or packaging format still prevents shipment.
What most people miss
Inventory risk is often nonlinear. One missing low-cost component can strand the value already invested in every other component. Conversely, an extra unit of a scarce input may unlock a complete, high-margin sale. Evaluate inventory by its ability to create shippable products, not merely by unit cost or warehouse quantity.
Calculate the full carrying cost
The purchase price is only the beginning. Add financing interest, storage, insurance, handling, shrinkage, quality degradation and administrative effort. Then estimate obsolescence: the probability that an item must be discounted, reworked or written off before sale.
A useful annual carrying-cost rate combines these expenses as a percentage of average inventory value. Apply it to the proposed incremental buffer, then add expected obsolescence losses separately if they are not already included. Compare that total with expected stockout losses avoided.
Timing matters. A buffer funded with supplier terms may be manageable; the same stock paid for months before sale can strain payroll and tax obligations. Model the cash outflow by week or month rather than relying solely on an annual profit-and-loss forecast.
Also calculate the break-even disruption probability. Divide the buffer’s expected incremental cost by the loss it would prevent in a defined disruption. If the resulting probability is far above what supplier evidence supports, the buffer is probably too large. If it is below a credible risk estimate, additional stock may be rational.
Set the buffer inside a liquidity limit
Apple’s scale should not anchor a smaller company’s decision. The relevant constraint is working-capital capacity: unrestricted cash, reliable borrowing availability and the time required to convert inventory into collected receivables.
Set a minimum liquidity floor before approving purchases. Stress-test slower sell-through, customer payment delays, higher borrowing costs and a partial inventory write-down. A resilience measure that creates a refinancing emergency simply exchanges operational risk for financial risk.
The secondary source’s account of a leveraged public-investment unwind provides a useful caution about liquidity and downside exposure, although a leveraged securities portfolio and operating inventory are not directly equivalent. In both cases, financing can amplify the cost of a wrong timing assumption. Assets may retain long-term value while still failing to generate cash when obligations fall due.
Use staged commitments
Do not treat the decision as all-or-nothing. Negotiate reserved capacity, split orders among suppliers, place smaller rolling commitments or prepay only for genuinely constrained inputs. Consider redesigns that allow interchangeable components. These options may cost more per unit but require less cash and reduce obsolescence exposure.
Manage inventory with triggers, not intuition
Review the buffer on a fixed cadence and assign an owner. Track days or weeks of supply, supplier lead-time spread, on-time delivery, backorders, forecast error, inventory turns, aged-stock percentage, gross margin return on inventory and borrowing-headroom utilization. Separate strategic safety stock from slow-moving inventory so excess is not mislabeled as resilience.
Define trigger points in advance. Increase protection when verified lead times breach a threshold, allocation notices arrive, supplier financial health deteriorates or forecast stockout costs rise. Reduce it when delivery performance normalizes, forecast error increases, aged inventory crosses its limit, product transitions approach or liquidity falls toward the floor.
Apple’s inventory build illustrates the scale of commitment that supply constraints can prompt. The transferable lesson is disciplined comparison: quantify the disruption being insured, price the insurance fully and keep enough liquidity to withstand the downside case.
Practical inventory-buffer checklist
- Identify the exact supplier, component or event that could stop shipments.
- Estimate stockout probability and losses from margin, downtime, penalties and churn.
- Measure average lead time, variability, on-time delivery and demand forecast error.
- Prioritize bottleneck inputs that unlock complete, sellable products.
- Calculate financing, storage, handling, shrinkage and obsolescence costs.
- Model base, disruption and slower-demand scenarios by month.
- Set minimum cash and borrowing-headroom thresholds before purchasing.
- Track weeks of cover, turns, aged stock, backorders and inventory return.
- Use explicit triggers for adding stock and dates for reducing it.
- Prefer staged orders, capacity reservations or interchangeable designs where feasible.