For commerce operators, inbound freight and outbound parcel shipping are not separate budgeting problems. They meet in the contribution margin of every order. A container-rate increase raises landed cost before inventory reaches the warehouse; a more expensive delivery service then adds pressure after the customer checks out.
Recent logistics developments illustrate why a resilient budget cannot rely on last quarter’s averages. Supply Chain Dive reported rising Asia-to-US East Coast ocean rates, while a separate report described higher USPS transportation expenses as the Postal Service adjusted to a contract under which UPS handles air cargo. These are signals of volatility across modes—not direct quotations for merchants. USPS-reported transportation costs are agency expenses, and published ocean-market rates are market indicators. Neither automatically equals the price on your carrier invoice or freight forwarder’s bill.
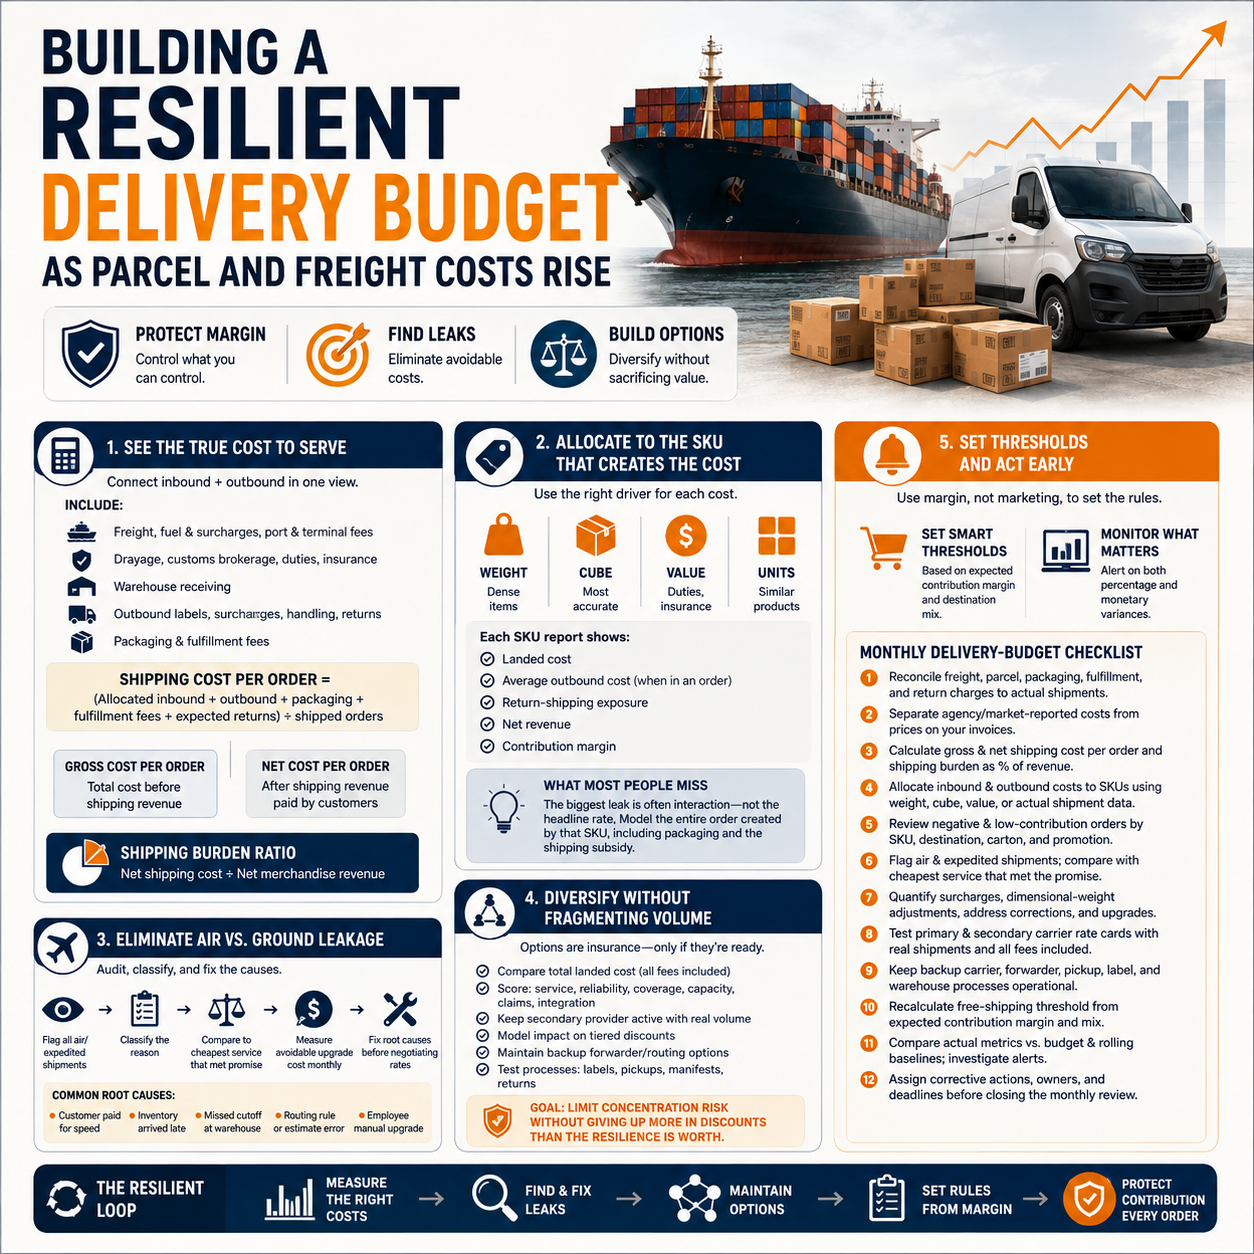
The operator’s task is to translate network volatility into order-level controls: measure the true cost to serve, locate avoidable service upgrades, retain alternatives, and trigger action before shipping consumes the margin.
Build one cost-to-serve view
Start with a monthly logistics ledger that joins inbound and outbound costs. For inbound freight, include the forwarder or carrier charge, fuel and security surcharges, port and terminal fees, drayage, customs brokerage, duties, cargo insurance, and warehouse receiving. Keep duties visible rather than burying them in a generic freight line; they may behave differently when product mix changes.
For outbound delivery, capture label charges, fuel, residential and delivery-area surcharges, additional handling, address corrections, declared-value fees, peak charges, return labels actually used, and fulfillment packaging. Reconcile invoices to shipments rather than using quoted base rates.
Calculate shipping cost per order as follows:
(Allocated inbound logistics + outbound transportation + packaging + shipping-related fulfillment fees + expected return transportation) ÷ shipped orders.
Track two versions. The first is gross cost per order. The second is net cost after shipping revenue paid by customers. Net cost reveals the amount the business subsidizes.
Then calculate a shipping burden ratio: net shipping cost divided by net merchandise revenue. Review it alongside contribution margin, not gross margin alone. A product can look profitable before fulfillment yet lose money after freight, parcel costs, payment fees, promotions, and returns.
Allocate costs to the SKU that creates them
A company-wide average can conceal expensive items. Allocate inbound costs to SKUs using the factor that drives the charge. Value may suit insurance or duties; weight may suit dense products; cubic volume is usually more useful when products consume container or pallet space. A blended method can allocate fixed shipment fees by units and variable freight by volume or chargeable weight.
For outbound costs, assign the actual label and surcharges to each order, then distribute that cost among its SKUs. Use dimensional weight or package volume for bulky items, physical weight for dense goods, and unit count only when products are similar. Preserve the order-level total so allocation does not create or remove cost.
Each SKU report should show landed cost, average outbound cost when included in an order, return-shipping exposure, net revenue, and contribution margin. Also segment by destination zone, package type, and order composition. This exposes products that trigger oversized packaging or push an otherwise economical basket into a higher billable-weight band.
What most people miss
The biggest leak is often interaction, not the headline rate. A low-priced bulky SKU can consume inbound cube, require a larger outbound carton, attract dimensional-weight billing, and qualify the basket for free shipping. Its apparent product margin says little about its true economic value. Model the whole order created by that SKU, including packaging and the shipping subsidy.
Find air-versus-ground leakage
The USPS transition involving UPS-handled air cargo matters as evidence that transportation networks and underlying costs can change. It does not prove that a merchant’s USPS price rose by the same amount, nor that another service is automatically cheaper. Audit your own invoices and service outcomes.
Create a shipment file containing origin, destination ZIP code, ship date, promised delivery date, actual delivery date, service purchased, zone, billed weight, dimensions, surcharge total, and label cost. Flag every air or expedited shipment, then classify the reason: customer paid for speed, inventory arrived late, warehouse missed cutoff, routing rule failed, ground estimate was inaccurate, or an employee manually upgraded service.
Compare each flagged shipment with the least expensive service that would have met the customer promise. The difference is avoidable upgrade cost. Measure it monthly as a percentage of outbound spend and by root cause. Fix operations before negotiating rates: move order cutoffs, improve inventory placement, correct carton data, and configure routing software to choose the cheapest service that satisfies the promise.
Diversify without fragmenting volume
Carrier diversification is insurance only when alternatives are operationally ready. Compare at least a primary parcel carrier, a credible secondary carrier or postal option, and regional providers where shipment density supports them. For inbound freight, maintain a second forwarder or routing option and evaluate alternative ports or modes for critical inventory.
Run representative shipments through each rate card, including contractual minimums and surcharges. Score providers on all-in cost, on-time performance, claims handling, pickup reliability, tracking quality, geographic coverage, capacity constraints, and integration effort. Avoid shifting volume merely to obtain an attractive base rate that disappears after residential, remote-area, or handling fees.
Give the secondary provider enough normal volume to keep accounts, labels, manifests, pickups, and warehouse procedures tested. At the same time, model whether moving volume weakens primary-carrier discounts. The goal is not an equal split; it is a deliberate allocation that limits concentration risk without sacrificing more in tiered discounts than the resilience is worth.
Set thresholds and variance alerts
A free-shipping threshold should come from margin, not a competitor’s banner. Estimate the order’s contribution before shipping: merchandise revenue minus discounts, product cost, payment fees, variable fulfillment, and expected returns. The order qualifies only when that amount can absorb the expected shipping subsidy while leaving the required contribution.
Model thresholds by shipping-cost band if destination and product mix vary materially. Exclude oversized items, use a surcharge, or offer free economy shipping rather than promising every service. Test threshold changes against conversion rate, average order value, units per order, shipping subsidy, and contribution per visitor. Higher revenue is not success if each added basket destroys margin.
Close the loop with monthly budget-versus-actual reporting. Create alerts for gross and net shipping cost per order, inbound cost per unit or cubic measure, surcharge rate, expedited share, dimensional-weight adjustments, carrier concentration, and contribution margin after logistics. Set thresholds using your own baseline—for example, a percentage variance from the rolling average plus an absolute monetary floor—so small fluctuations do not create noise. Assign an owner and required response to every alert.
Monthly delivery-budget checklist
- Reconcile freight, parcel, packaging, fulfillment, and return charges to actual shipments.
- Separate agency or market-reported costs from prices appearing on merchant invoices.
- Calculate gross and net shipping cost per order and shipping burden as a share of revenue.
- Allocate inbound and outbound logistics costs to SKUs using weight, cube, value, or actual shipment data.
- Review negative and low-contribution orders by SKU, destination, carton, and promotion.
- Flag air and expedited shipments; compare them with the cheapest service that met the promise.
- Quantify surcharges, dimensional-weight adjustments, address corrections, and avoidable upgrades.
- Test primary and secondary carrier rate cards with representative shipments and all fees included.
- Keep backup carrier, forwarder, pickup, label, and warehouse processes operational.
- Recalculate the free-shipping threshold from expected contribution margin and destination mix.
- Compare actual metrics with budget and rolling baselines; investigate alerts above both percentage and monetary limits.
- Assign corrective actions, owners, and deadlines before closing the monthly review.